Monitor your cron jobs.
Know when they fail.

Comprehensive monitoring for scheduled tasks. Capture failures, error logs, and custom status codes. Get notified instantly when something goes wrong.

Free tier includes 5 monitors. No credit card required.

How it works

Your servers send periodic heartbeats. When they stop - or logs reveal a problem - you get notified instantly.

Web Server curl POST /ping Cron Job */5 * * * * Docker Container healthcheck telemetry.host monitoring hub AI Analysis Email Slack Discord Webhook heartbeat ✓ ping ✓ alert! notify

Multi-channel alerts

Email, Discord, Slack, and 50+ notification channels.

Detailed error logs

Capture custom status codes and full error logs, not just missed pings.

Historical analysis

Track success rates, uptime statistics, and failure patterns over time.

Grace periods

Set flexible check-in timeouts, frequencies, and grace periods for your scheduled tasks.

Auto-provision

Auto-provision monitors for your projects.

Secure & reliable

Unique monitor URLs, HTTPS-only, with 99.9% uptime SLA.

Detect failures with AI

AI-powered log analysis reduces false positives from SMART disk reports and technical output.

Included in free tier

AI-powered visualization
& alerts

Send any output from your jobs - raw log text, JSON payloads, SMART reports, backup stats. The AI pipeline reads it, recognises what's worth tracking, suggests which metrics to chart and what to alert on, then builds the dashboards automatically.
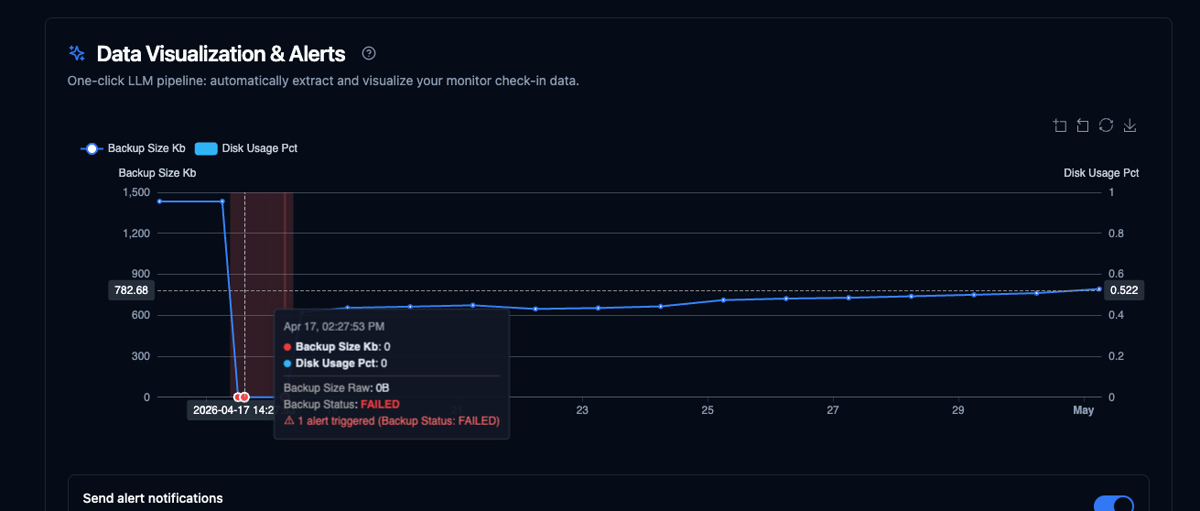
AI-detected backup failure chart with alert tooltip

Alert detection

Catch failures before
they cost you

AI analyzes check-in payloads, generates alert rules automatically, and annotates the exact data point where things went wrong - like a backup dropping to 0 bytes.

  • LLM-generated alert rules from your data shape
  • Instant notification on threshold breach
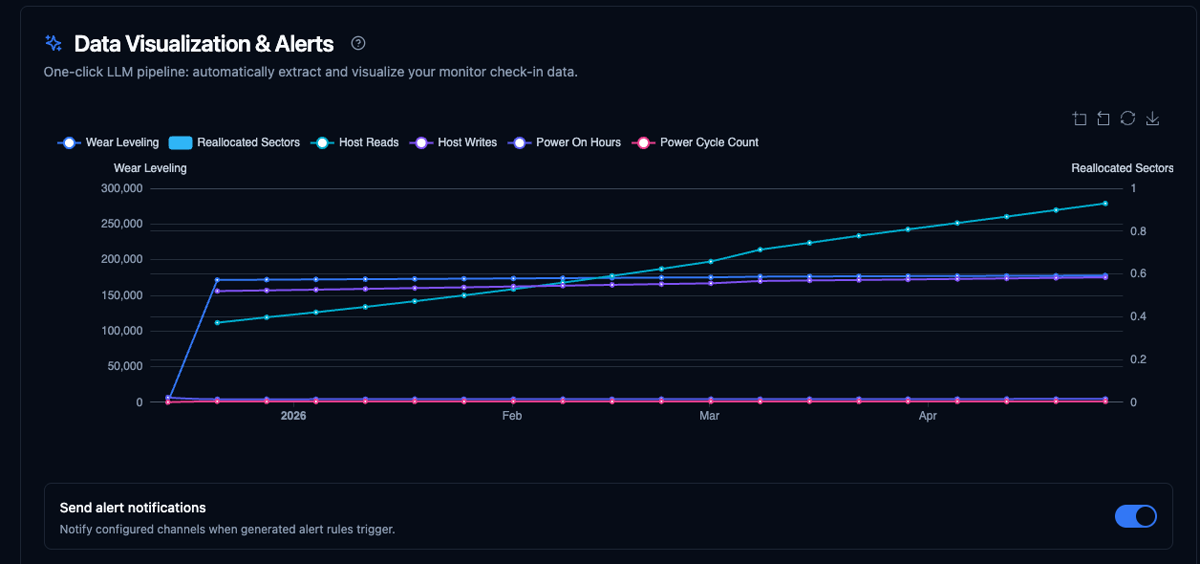
Auto-charting

Any structured data,
instantly charted

Works on any output - structured JSON, plain log text, SMART reports, even free-form prose. The AI reads the content, identifies the meaningful signals, recommends which fields to chart and which thresholds to watch, then renders the dashboard in seconds.

  • Structured JSON and unstructured text - no schema required
  • AI recommends metrics to track and thresholds to alert on
  • Multiple metrics on one chart, dual axes
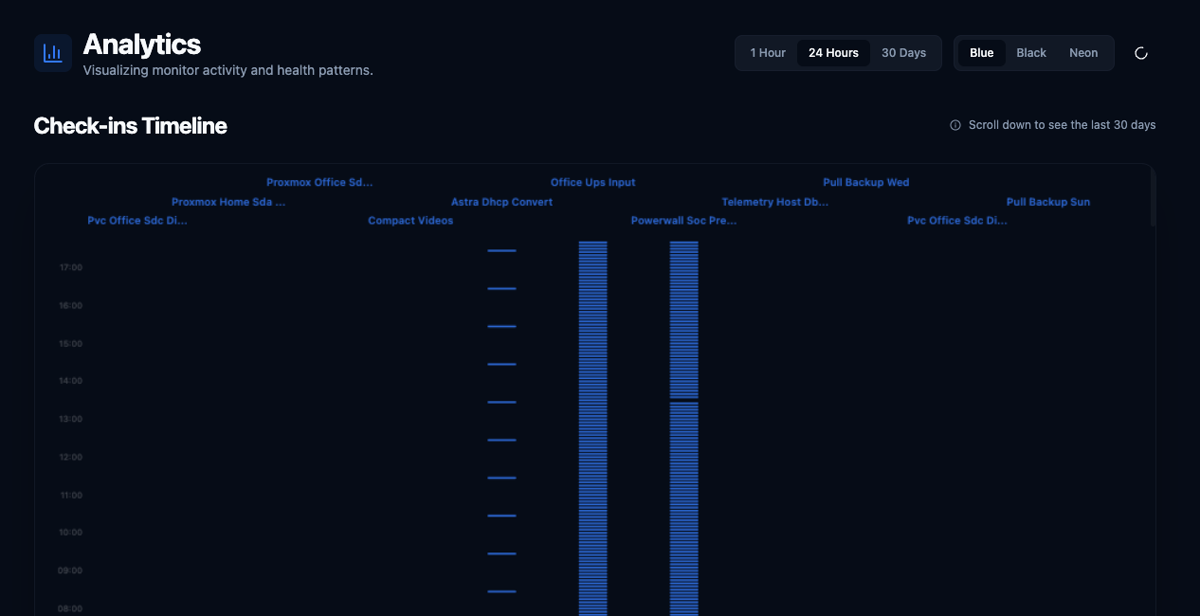
Multi-metric SSD SMART health chart with 6 data series
Check-ins Timeline analytics view showing all monitors across 24 hours

Analytics

See your entire fleet
at a glance

The built-in analytics timeline plots every check-in across all your monitors on a single canvas. Spot gaps, burst patterns, and missed runs in seconds - no log digging required.

  • 1-hour, 24-hour, and 30-day views
  • Blue, Black, and Neon colour themes

Simple integration

Add a single POST request to your cron job. That's it.

# Add to your cron job (timeout mode)
curl -X POST https://telemetry.host/ping/your_key/timeout/1d1h/daily-backup?create=1 \
-d '{"status": "success", "duration": 120}'
# Auto-creates monitor if it doesn't exist. Alert if no check-in within 1 day + 1 hour.

Monitor disk health with SMART

Send daily SMART reports and get alerted only when there's a real problem. AI analysis understands technical metrics and reduces false positives.

# Add to your daily cron job
smartctl -a /dev/sda | curl -X POST \
https://telemetry.host/ping/your_key/timeout/1d1h/disk-health?create=1 \
--data-binary @-
# AI detects real failures, ignores technical keywords like "Error_Rate" in metric names

Start monitoring in 2 minutes

Create an account, set up your first monitor, and get instant alerts when your jobs fail.

Get started for free